

How to Read Mobile Phone Price History Charts
Last updated: November 18, 2026
Quick Answer: a mobile phone price history chart is most useful when it shows the launch price, the current price, and enough time for a real pattern to emerge. Read the line first, then the dates, then the gaps between drops, and you can tell whether the listing is changing in a meaningful way.
A mobile phone price history chart shows where the launch price started, how the current price compares, and whether recent price drops are part of a real trend or just a short sale period. Read the line first, then the dates, then the gaps between drops, and you can tell whether the listing is changing in a meaningful way.
A price chart is most useful when you already know the model you are comparing and want to judge the pattern, not chase the latest discount. That is the job here. It is not a buying guide, and it is not a “best time to buy” page. It is the guide to interpreting the chart itself so you can use the number that matters and ignore the noise.
Key takeaways
- The launch price is the starting point; the current price is the number you compare against it.
- A single price drop is less important than the shape of the line over 30, 60, or 90 days.
- Sale periods often create short dips that do not mean the phone has permanently reset lower.
- Small, repeated drops can matter more than one big discount if the chart keeps making lower highs.
- If the chart only shows a few days, treat it as incomplete history, not a reliable pattern; if you are making a purchasing decision, consider checking a longer chart and consulting a qualified professional if needed.
- A useful chart should make it easy to spot price trend lines, sale periods, and the size of each drop.
What a mobile phone price history chart is telling you
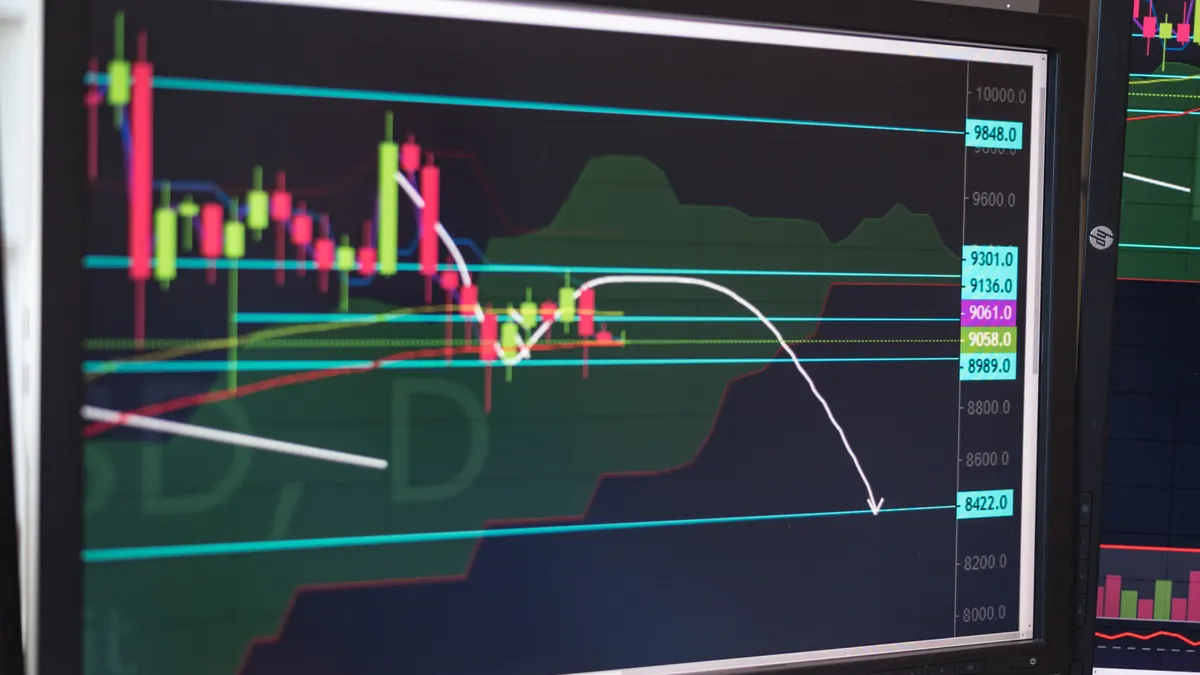
A mobile phone price history chart tells you how the listed price has moved across time, usually against a date axis. Most charts show a line, bars, or points with the launch price on one end and the current price on the other, plus intermediate changes during sale periods. If the chart is well built, you can see whether the price has drifted down gradually, dropped sharply around a promotion, or stayed flat for months.
The main thing to look for is the relationship between the launch price and the current price. A launch price of $799 and a current price of $649 can mean a meaningful reduction, but the exact interpretation depends on the chart’s full history. The second chart shows volatility, not a lasting markdown.
A generic chart can mislead if you read the last price only. That last point may reflect a sale period lasting 48 hours, an outlier from one retailer, or a temporary stock event. The chart matters because it shows whether the current price is part of a pattern or just a snapshot.
When the chart includes a long span, such as 180 days or a full year, you can judge whether the line has a steady downward slope or a step-down pattern. Both can be useful, but they mean different things. A steady slope suggests repeated softening. A step-down chart often means short promotions separated by flat stretches.
If the chart is missing dates, labels, or a clear start point, it is weak evidence. A clean chart should name the model, show the price scale, and indicate the date range. Without those, the line is decoration, not data.
How do you read a phone price chart?
You read a phone price chart by checking the start price, the lowest points, the current price, and the time between each move. That sequence tells you whether the listing has genuine downward movement or just a few temporary dips.
Use this procedure:
-
Find the launch price first.
Look for the first price shown when the model was introduced or first tracked. A launch price sets the baseline, so every later number is judged against that starting point. - Read the latest point on the chart and compare it with the launch price. If the current price is $849, the chart shows a $150 difference from the start, which is more useful than a vague “discounted” label.
-
Look at the size of each price drop.
Note whether drops are small, such as $20 to $50, or larger, such as $100 or more. Smaller drops repeated over several weeks usually show a slow slide; one larger drop may just be a sale period. -
Measure the time between changes.
A chart with drops every 7 days behaves differently from one that changes every 60 days. Frequent changes suggest active pricing. Long flat sections usually mean the retailer held the price steady. -
Check the shape of the trend line.
A line that slopes down steadily is easier to read than one with sharp spikes. A spike down and back up often means a limited promotion, not a new normal. -
Compare against the model’s age.
A chart for a 2-week-old phone is not comparable to one for a model that has been on sale for 8 months. Older listings usually have more price movement and more data points, which makes the pattern clearer. -
Read the chart in context, not in isolation.
If the chart has a sale period labeled for 3 days, do not treat that dip as the ongoing price unless the line stays low afterward. The lasting number is the one that remains after the promotion ends.
This process works because the chart is a record of movement, not a promise. A good reading tells you whether the price is drifting, bouncing, or resetting.
Launch price vs current price: the comparison that matters most
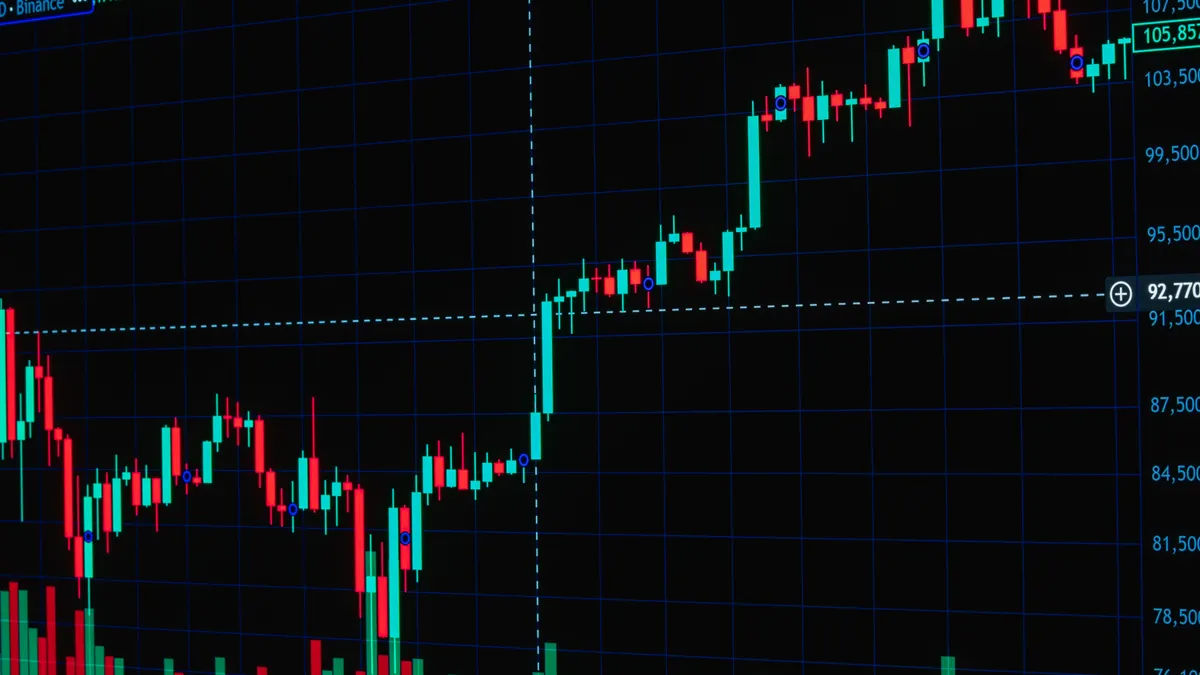
The launch price vs current price comparison is often the fastest way to understand whether a listing has meaningfully moved since release. If the launch price was $899 and the current price is $799, the chart shows a $100 drop from the original figure. That is the baseline comparison most readers need before they care about anything else.
But the launch price alone can mislead if you stop there. Some models launch high and then sit at that level for months. Others fall quickly after the first few sale periods. The chart’s value is in showing which of those patterns you are looking at. A current price that is only $30 below launch may still be normal if the phone is new and prices have barely started to move. A current price that is $200 below launch may reflect repeated markdowns, not one dramatic sale.
The other mistake is comparing the current price to the lowest point ever shown on the chart and treating that as the standard. That lowest point may have lasted only 24 hours. If the chart includes a black Friday-style sale period or a weekend event, the low may be real but temporary. The chart helps you avoid confusing the floor with the average.
A useful comparison also depends on the scale shown. A 5% move on a chart that starts at $1,200 is not the same as a 5% move on a $300 model. If the chart does not show percentages, you can still read the size of the drop in dollars and the spacing between points. That is often enough.
The cleanest reading is this: launch price gives you the original anchor, current price gives you the present market number, and the line between them shows whether the change is gradual or abrupt. If the chart does not make those three things obvious, it is not giving you enough information.
Price trend lines that actually mean something
Price trend lines mean something only when they connect multiple points across enough time to show direction. One point is a price; three points may still be noise; a line over 60 or 90 days starts to say something useful. The shape matters more than any single dip.
A downward trend line usually looks like one of three patterns. First, it can slide down in small steps, such as $20 every few weeks. Second, it can hold steady and then drop in larger jumps, such as $50 to $100 after specific sale periods. Third, it can zigzag while still moving lower overall. All three can point to weakening price resistance, but they are not equally clean.
The mistake most readers make is trusting the lowest point on the chart more than the line. A low point on its own may be a one-day promotion. A trend line that keeps making lower highs tells you the market is shifting more reliably. If a chart shows $799, then $749, then $729 over 90 days, that is a clearer signal than a single flash drop to $699 that immediately disappears.
Look for the distance between peaks as well as the distance between dips. If each new high is lower than the last one, the line is weakening. If the price keeps bouncing back to the same level after every sale period, the chart is probably flat, even if it looks busy.
For a reader comparing two models, this is the most useful test: which chart has the cleaner downward slope over the longer stretch? A phone with a modest drop but a stable line may be easier to interpret than a phone with wild spikes that create false excitement.
The chart should never be read as a guarantee of future movement. It is a record of past movement. That distinction matters because a line that fell for 90 days can still flatten tomorrow.
Spotting sale periods without mistaking them for permanent drops
A sale period is a short window where the price falls and then often returns toward the prior level. On a chart, it usually appears as a sharp dip lasting a few days, sometimes 24 to 72 hours, followed by a rebound or a pause. That shape is a clue that the lower number may not be the new normal.
The easiest way to spot a sale period is to look for a V-shape or a deep notch in the line. If the price falls from $850 to $750 over a weekend and then climbs back to $830, that is a promotion, not a new baseline. If the price falls to $750 and stays there for several weeks, the drop is more likely to be structural.
This distinction matters because readers often overvalue the temporary low. A chart with a dramatic holiday sale can look more attractive than a slower, steadier chart, even if the steadier chart ends up being more useful for decision-making. A temporary dip is emotionally loud; a persistent trend is more informative.
Seasonal patterns also show up in the chart, but only if you have enough history. Around major shopping periods, you may see recurring dips of a similar size and duration. If the chart spans only 14 days, you cannot infer a pattern from one sale. If it spans 12 months, repeated dips around similar dates begin to matter. The chart itself cannot tell you why the dips happen, but it can show that they recur.
This is where a reader should be cautious. A sale period is a data point, not a verdict. The chart may show a $100 drop, but without the longer line, you do not know if that drop lasted 2 days or 2 months. Use the chart to separate a promotion from a reset.
Seasonal patterns: how to read recurring movement over time
Seasonal patterns appear when the chart shows repeated price behavior at roughly similar times across a year or across multiple quarters. You are not trying to forecast the future here; you are checking whether the price line has recurring shapes that make the chart easier to interpret.
The most common sign is a cluster of dips separated by long flat periods. If the same model shows lower points during several sale periods and then returns to a higher band, the chart is telling you that the market responds in bursts rather than through constant decline. That is useful because a burst pattern is easier to recognize than a random one.
To read seasonal movement well, the chart should cover at least 6 months. A 30-day chart is too short to show much beyond a short promotion. A 12-month chart is much better because it gives you enough space to compare one sale period with another. If your chart covers less than that, treat any “pattern” as provisional.
A good seasonal chart often has two layers of meaning. The first layer is the short-term dip, such as a discount that lasts 3 to 10 days. The second layer is the broader level the price returns to afterward. If the return level keeps slipping lower after each cycle, the seasonal pattern is not just repeatable; it is also trending downward.
That is the point of reading the chart carefully. You are not asking only, “Did it go down?” You are asking, “Did it go down briefly, or did the whole band of prices shift?” The second question is the one that helps you interpret the chart correctly.
If a chart shows no repeated dips at all, that is also a finding. It may mean the seller keeps the price stable, the model is too new for pattern building, or the chart source has too little history. A chart with no seasonality is not worse; it just gives you less to work with.
Common chart mistakes that cost readers the real signal
The biggest mistake is reading a short-term dip as proof of a lower market price. That mistake can cost you the difference between a one-day promotion and a real downward move. The fix is simple: check whether the lower price lasts beyond the sale period and whether the line keeps that level afterward.
A second mistake is ignoring the time scale. A $50 drop over 7 days means something different from a $50 drop over 90 days. The first is fast movement; the second is a slow slide. If the x-axis is compressed, the chart can hide how fast the price really moved.
A third mistake is treating missing data as stable data. Some charts have gaps, especially if the listing was out of stock or not tracked continuously. A gap can make a drop look cleaner than it is. If the chart skips several days, do not assume the line stayed flat unless the tool clearly says so.
A fourth mistake is comparing charts with different histories as if they were the same. One chart may show 180 days and another only 14. The shorter one is not wrong, but it is less complete. If you need to understand whether a price drop is meaningful, a longer chart usually helps more.
A fifth mistake is overreacting to the lowest point. A chart can show a deep dip of 1 day and still be mostly flat for the rest of the month. The lowest point is useful, but only when you can see how long it lasted and whether the price recovered.
This is also where the limit of chart reading becomes clear. A chart can tell you how the price moved, not why it moved. That means it is good for interpreting patterns and bad for explaining causes. For a broader method stack, this page belongs beside the other mobile phone price research methods on the hub, and it works best when you pair it with Apple’s official iPhone technical specifications and the GSMArena phone database for model details and dates.
Drafted with AI; not yet reviewed by a person.